The Cloud infrastructure for 3D Geospatial Information supports all kinds of data formats, such as flooding, weather data, underground pipelines, and LiDAR etc. The 3D GIS development platform supports all kinds of widgets for the programmers to integrate easily and follow the OGC protocol to display the theme maps on the website.
Successful Cases
All-In-One Demo
Successful Cases
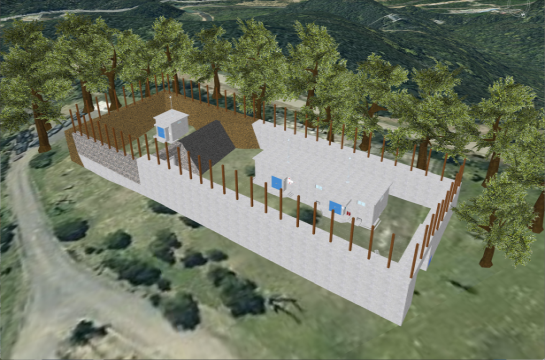
3D Explosives Depot Management System in Mining Areas
The 3D Explosives Depot Management System, developed in collaboration with the Central Geological Survey of the Ministry of Economic Affairs, establishes a digital twin of explosives depots using 3D GIS technology. By integrating 3D models of depots, terrain, and imagery data, it simulates explosion and disaster response scenarios, thereby enhancing depot management and emergency response capabilities.
Successful Cases
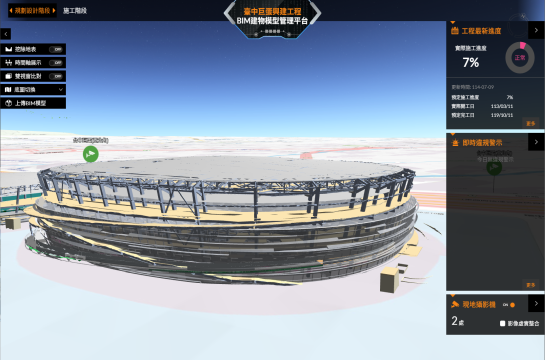
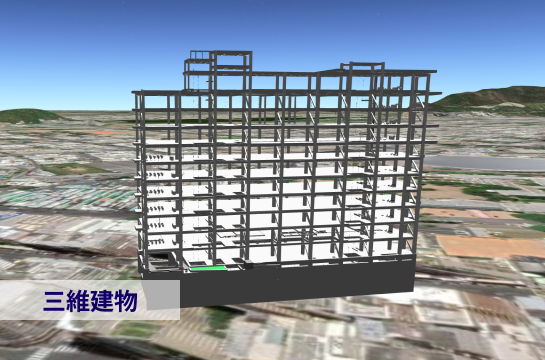
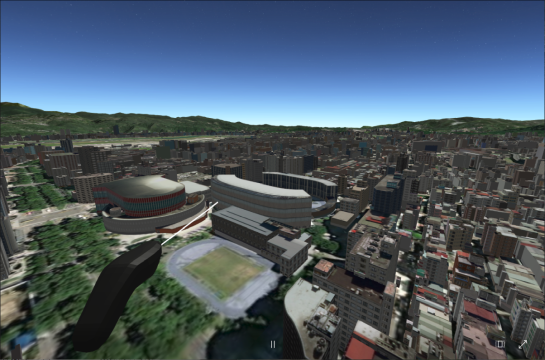
3D Construction Safety Management System
The 3D Construction Safety Management System, developed in partnership with the Taichung Construction Bureau, incorporates BIM, GIS, and IoT technologies to build dynamic visualizations of construction phases for the Dome project, along with occupational safety monitoring modules. This system strengthens on-site safety management and progress tracking, improving the accuracy of engineering project management.
Successful Cases
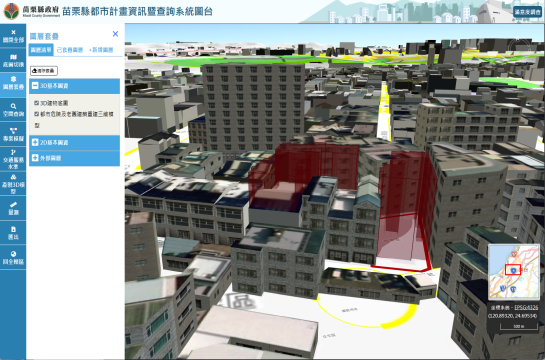
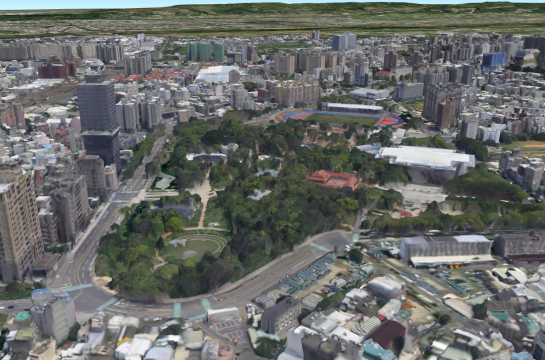
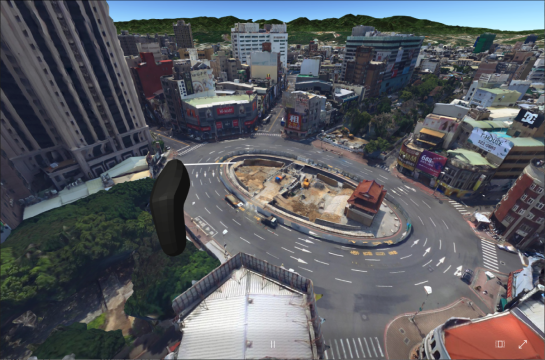
3D Smart Urban Planning Simulation System
The 3D Smart Urban Planning Simulation System, developed in collaboration with the Urban Planning Division of the Miaoli County Government, integrates urban planning information through a 3D platform. It provides temporal planning simulations, building height restriction calculations, and visualized presentations of redevelopment areas, assisting agencies in grasping urban development patterns and improving the efficiency of planning and review processes.
Successful Cases
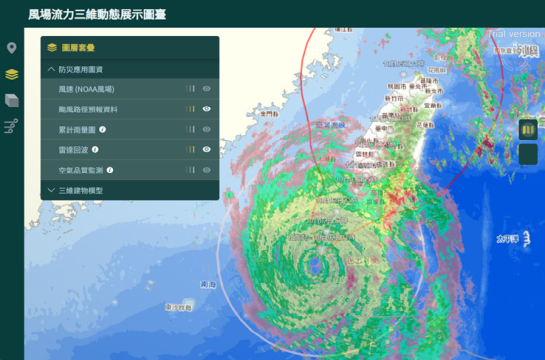
3D Wind Field Platform
The 3D Wind Field Platform integrates publicly available meteorological data from sources such as the Central Weather Administration (CWA) of Taiwan and the National Oceanic and Atmospheric Administration (NOAA) of the United States. It can display dynamic global wind flows, typhoon path forecasts, accumulated rainfall, radar echoes, air quality, and more. The platform also provides sharing tools, allowing users to upload their own or third-party data. Additionally, 3D data can be presented using voxels or multi-layer wind field visualization, offering users diverse meteorological data display capabilities.
Successful Cases
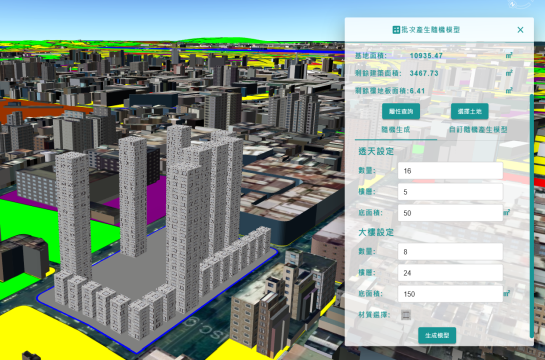
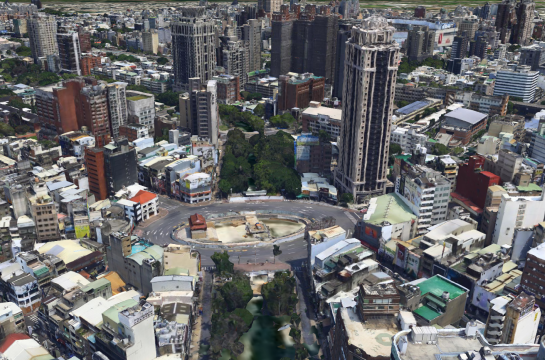
Urban Development Simulation Platform
The 3D urban development simulation platform is a collaboration between the National Center for High-performance Computing (NCHC) and the Kaohsiung City Urban Development Bureau. It integrates city-wide approximate building models and detailed landmark representations while also providing shared tools such as urban renewal assessment support. Users can quickly generate randomized models for designated land plots to preview potential post-renewal scenarios. Additionally, the platform features map navigation, overlay layers, visibility analysis, and disaster-prone area decision support, enhancing urban planning and development processes.
Successful Cases
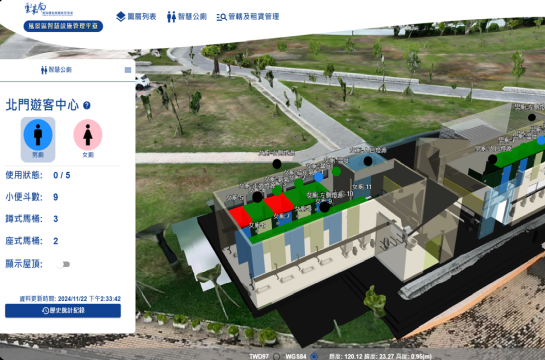
Smart Facility Management Platform for Scenic Areas
In collaboration with the Southwest Coast National Scenic Area Administration, the National Center for High-performance Computing (NCHC) has developed a 3D smart facility management platform, with Beimen Visitor Center as a demonstration site. Integrating IoT technology, the platform displays restroom usage data on a management dashboard and automatically notifies cleaning staff when necessary. Additionally, it is integrated with jurisdiction and leasing management systems, allowing authorities to monitor business leasing status within the scenic area. This provides government agencies with a comprehensive platform for monitoring and management.
Successful Cases
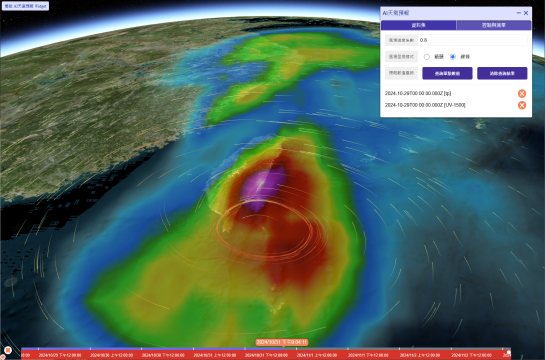
AI Weather Forecasting
The AI weather forecasting module is integrated with NVIDIA's Earth-2 platform, which leverages high-precision data-driven AI models to rapidly and accurately predict global weather. It generates multidimensional meteorological data, including temperature, precipitation, and wind fields. Through the 3D co-construction platform's wind field module and visualization layers, the AI weather forecast results can be seamlessly displayed on the map. This 3D visualization not only enables meteorologists to analyze weather changes more intuitively but also provides the public with more user-friendly and comprehensible weather imagery.
Successful Cases
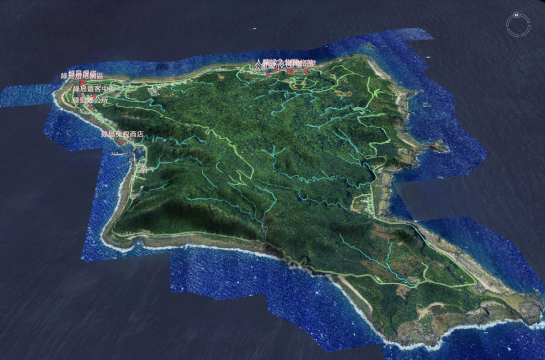
Ludao Digital Twins Demo
Taitung County Government and Department of Land Administration produce and maintain the high-precision GIS data of Ludao. Which includes high-precision DTM, digital aerial images, building models, etc. By the 3DGDP, the digital twins demo website of Ludao could be create rapidly. And we use several widgets like AR/VR, Users Map to develop the application, which is properly apply on tourism and education.
Successful Cases
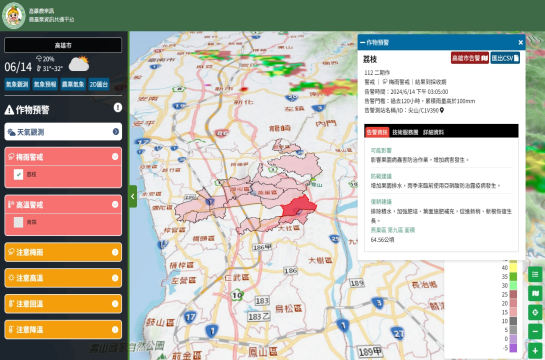
Smart Agriculture Platform
By combining agricultural information and meteorological data, hourly disaster warning analysis can be conducted, establishing a three-dimensional agricultural disaster prevention application. This system can display weather maps of rainfall, lightning, temperature, and more, providing users with clearer, three-dimensional disaster warning analysis maps.
Successful Cases
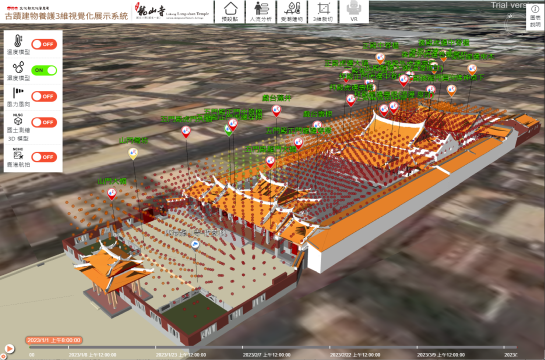
Heritage Building Maintenance 3D Visualization Display System
The Digital Twins for the Maintenance of Monuments and Buildings cooperated with the Bureau of Cultural Heritage, Ministry of Culture. It is more convenient to integrate the 3D historical buildings and monitor data from temperature and humidity sensors. Combination with the meteorological data, such as temperature, and humidity changes to assist the public sector in monitoring cultural assets and serve as a reference for prevention and response for further management.
Successful Cases
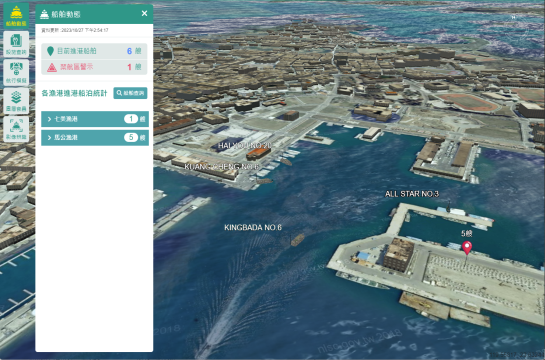
Digital Harbor 3D Vessel Dynamic Information System
The Digital Twins for the fishing port management system cooperated with the Penghu County Government Public Works Department which integrated with the AIS data and AI image recognition technology to monitor the entering/exiting fish boats of the fishing port. It monitors the throughout of the fishing boats and make an electronic fence to alert the fishing boats keep dangerous away.
Successful Cases
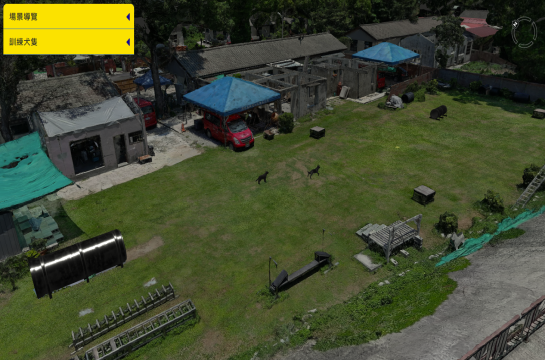
Search and Rescue Dog Daily Training 3D Virtual Scene Display Platform
The Digital Twins for the search and rescue dog training system cooperated with the Fire Bureau of Taichung City Government which tried to combine the daily training cases of the dogs with the 921 Earthquake Museum of Taiwan using 3D GIS. It focuses on the introduction of daily training cases and heroic deeds of the search and rescue dogs in Taichung to protect them be distrubance and also teach people to understand how serious the disaster is.
Successful Cases
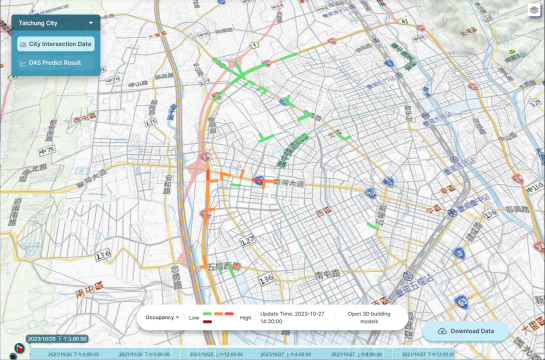
Traffic Congestion Prediction System
The Smart City Project, a collaboration between the National Center for High-performance Computing (NCHC), National Yang Ming Chiao Tung University (NYCU), Washington University and Massachusetts Institute of Technology (MIT), aims to create a life centered urban information sharing system. The platform uses the team's multi-target tracking technology in conjunction with NCHC's high-speed computing platform (HPC) to identify and integrate urban camera information ranging from pedestrian behavior to vehicle tracking and identification. By incorporating quantum optimization technology, the platform provides information optimization to traffic units, enabling improvements to intersection-related signage and other issues.
Successful Cases
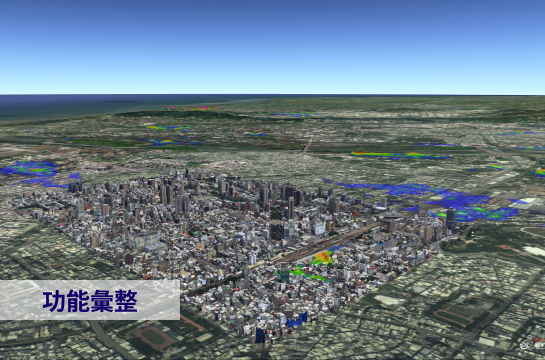
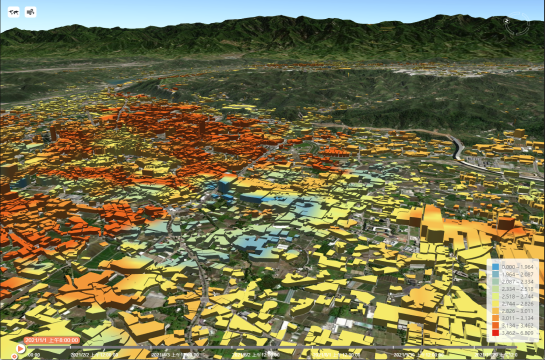
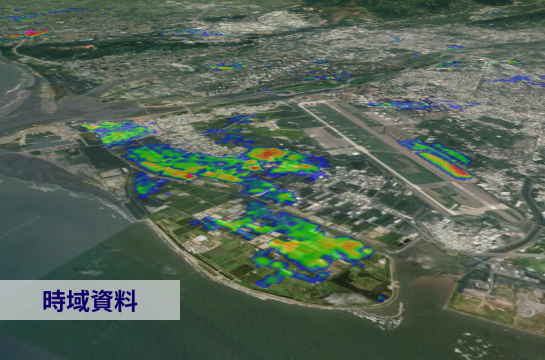
Air Pollution
The Environment monitoring display system, a collaboration with the Geomatics and Environmental Health Laboratory, NCKU. It focuses on the integration of the time-series data of particle material of air pollution to display with 3D buildings and also provides the simulation data based on OGC WMS, and WCS protocols.
Successful Cases
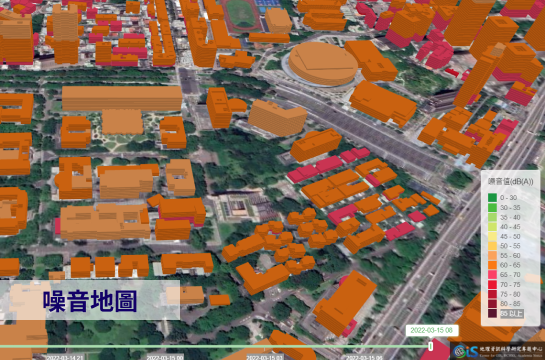
Noise Map
The Noise Map service, which collected sounds from Sound Box devices around Taipei City, was provided by the Center for GIS, RCHSS of Academia Sinica, and leveraged the 3D building data from the National Land Surveying and Mapping Center, MOI. People can easily see the volume of the sounds change as time passes and lead to different experiences of different floors.
Successful Cases
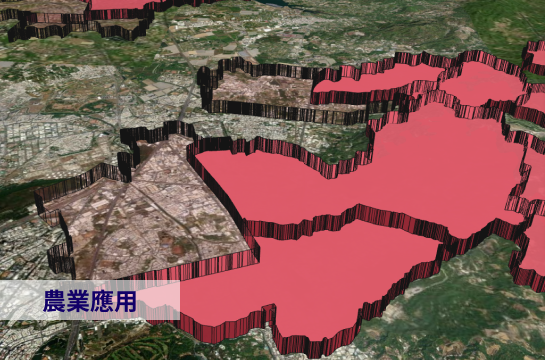
Intelligent Agriculture
The Smart Agriculture Platform, which focused on the main crop statistics and analysis, the data was collected by the Agriculture Bureau of Kaohsiung Government and integrated the Crop AI models to identify the area of crops. People can understand the statistics of the volume of the crops.
Successful Cases
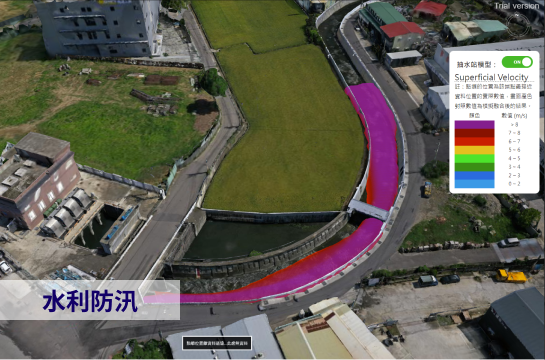
Water Resources Application - Alarm of Pumping Station
In order to increase the geospatial integration abilities of water resource agencies. NCHC co-works with the Water Resources Bureau of the Taichung City Government and focuses on how to repeat the historical flooding case of the Wuxi Basin with a digital twin concept. According to historical water resources data build up the early alarm system of the pumping station by applying an AI water level recognized.
Successful Cases
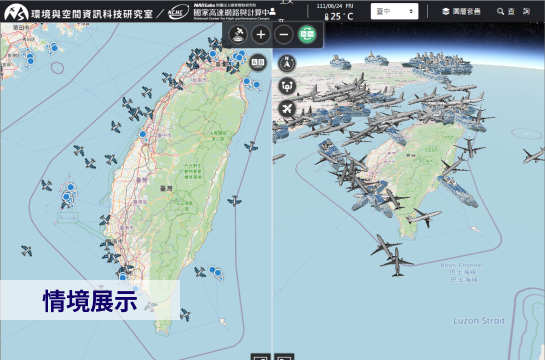
Geospatial Intel Integration
This 3D ocean and air information platform collected flight information, satellite trajectories, and shipping boats' GPS information. It could manage, arrange, and search certain objects to get real-time situations around the Taiwan.
Successful Cases
Underground Pipelines Platform (Tainan)
The 3D GIS underground pipelines platform is co-working with the Tainan government and leverages the 3D building data from the National Land Surveying and Mapping Center, MOI. It tries to provide a communication website that could record the location of pipeline conflict and save the conflict’s negotiation Process.
Successful Cases
The Comprehensive GIS Convenience Display Platform
The comprehensive Geographic Information System (GIS) convenience display platform, a collaboration between the National Center for High-Performance Computing and Keelung City Government, not only features a 3D display of Keelung's city buildings and topography but also integrates functionalities such as real estate transaction registration, land registration inquiry, soil and water conservation, fire prevention and disaster response, urban planning, and multi-window historical data comparison.
Successful Cases
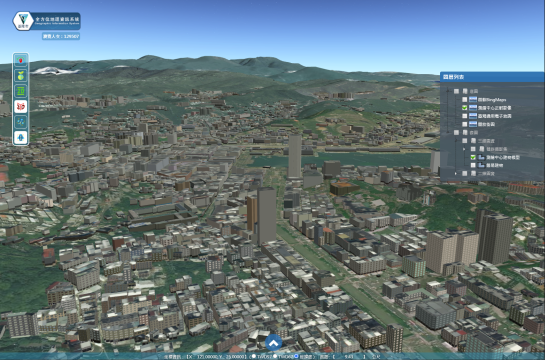
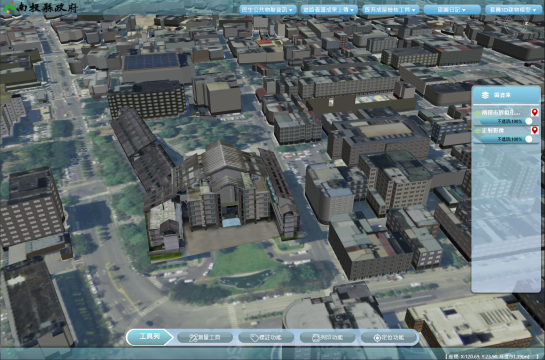
The Cloud-Integrated Geographic Information Service Display Platform
The cloud-integrated geographic information service display platform, a collaboration between the National Center for High-Performance Computing and Nantou County Government, integrates tools such as public IoT information, road maintenance results, and existing building inspection. Additionally, it offers features like travel diaries to promote tourism for the public and tourism industry professionals.
Function module
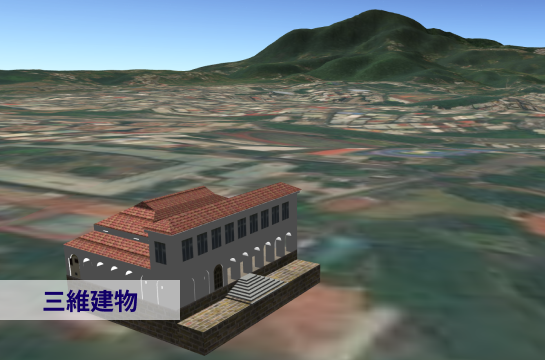
Single Building Model
Single Building Display (Tamsui Customs Officer's Residence)
Function module
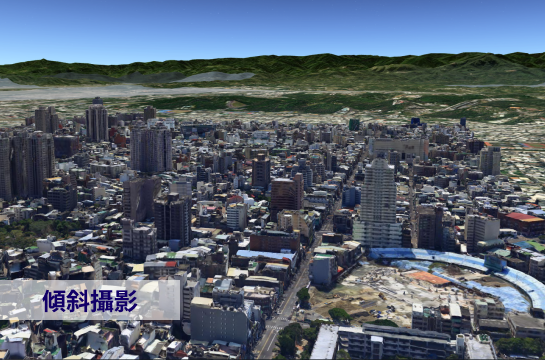
Photogrammertry Model (HSinchu City)
Oblique Photographic Building Modeling Display (Hsinchu City Center)
Function module
BIM(Building Information Modeling)
BIM Model Display, Providing Sectional View Functionality to Showcase Internal Structures and Objects of Buildings.
Function module
Hsinchu City Building Models(20200428)
In addition to uploading their own building models to the server, platform developers can also access shared layers (DataLake) provided by the 3D co-construction platform. These layers include multiple datasets of oblique photogrammetry-based city building models. This particular dataset consists of partial building models of Hsinchu City, produced on April 28, 2020.(Note: Due to data sensitivity, a password is required for access.)
Function module
Hsinchu City Building Models(20200717)
In addition to uploading their own building models to the server, platform developers can also access shared layers (DataLake) provided by the 3D co-construction platform. These layers include multiple datasets of oblique photogrammetry-based city building models. This particular dataset consists of partial building models of Hsinchu City, produced on July 17, 2020.(Note: Due to data sensitivity, a password is required for access.)
Function module
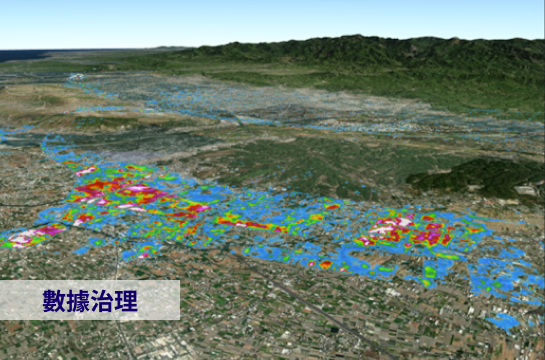
Flooding Simulation
To ensure the effectiveness of hydrological numerical model applications, data is compiled and categorized based on the start and end times and rainfall conditions affecting the regions during historical flooding events. The process is visualized in a 3D platform to simulate the flooding progression, enabling users to quickly understand the flooding history in the Hsinchu area.
Function module
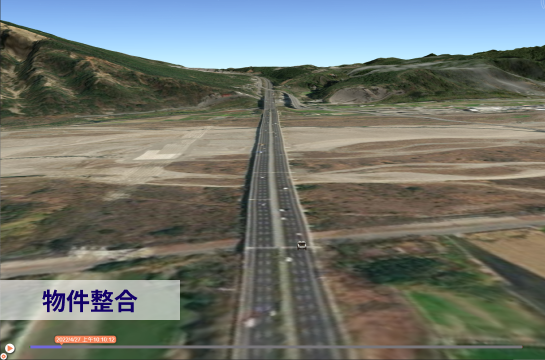
Dynamic Objects
Through the dynamic display of moving objects (vehicle models), various features of the platform's timeline are presented, such as dragging the timeline to correspond to object positions and adjusting playback speed.
Function module
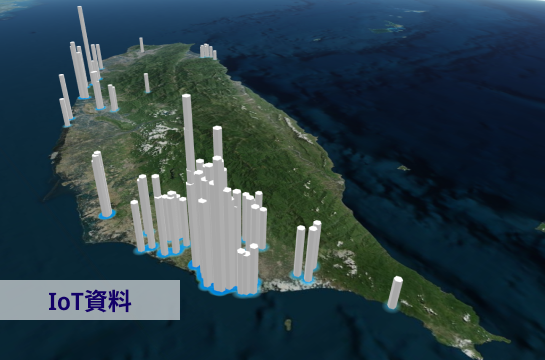
IOT Infomation
Real-Time Air Pollution Information Display (Civil IoT Taiwan)
Function module
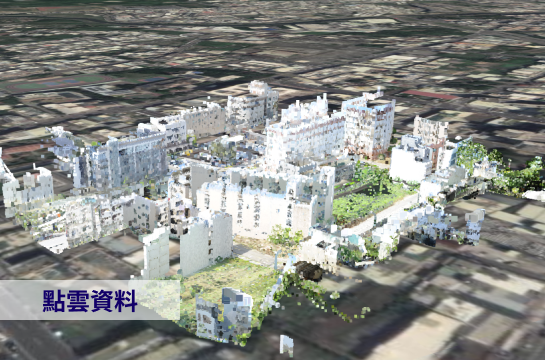
Point Cloud
Xinyi Section Point Cloud Data Display
Function module
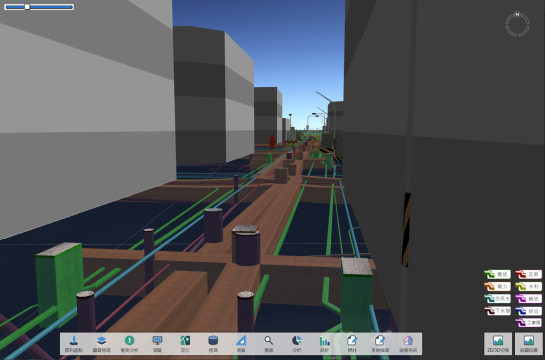
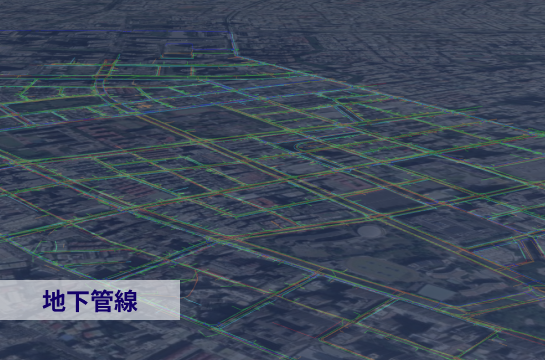
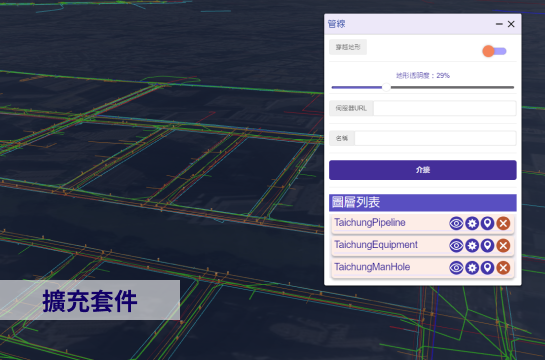
Pipelines
The 3D Underground Pipeline Display System primarily serves to present, analyze, and utilize the three-dimensional spatial data of various public underground pipelines. The main issues with pipeline data are inaccuracies and gaps. Government agencies aim to use the 3D GIS platform to display the results of pipeline data conflicts, which can be fed back to the 2D system as a reference for data correction and completion. This system is also used to enhance the efficiency of road excavation convenience systems. By quickly analyzing pipeline conflicts using the 3D display system, it provides valuable insights and applications for relevant authorities.
Function module
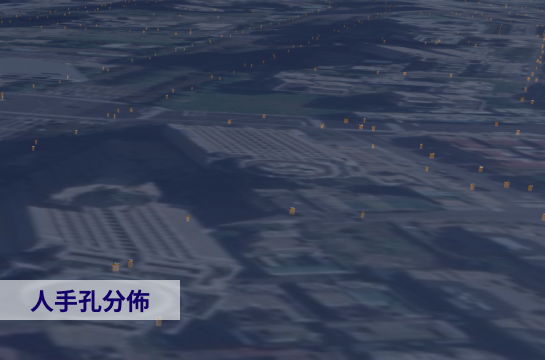
Handholes
Taichung Area Manhole Model Display (requires adjustment of "Layer Settings - Terrain Perspective")
Function module
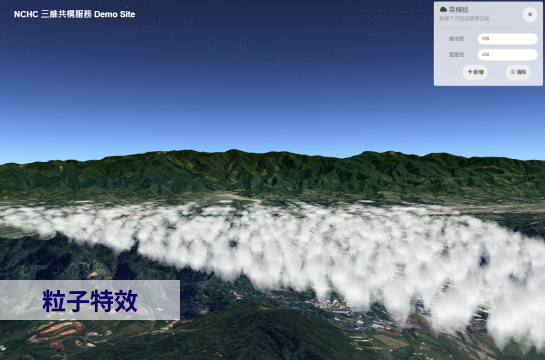
Particle Effect - Cloud
Particle Effects - Cloud Module: To operate, click the "Add" button, then left-click and drag on the 3D map to select an area. Repeatedly clicking the mouse will complete the selection and create the cloud module.
Function module
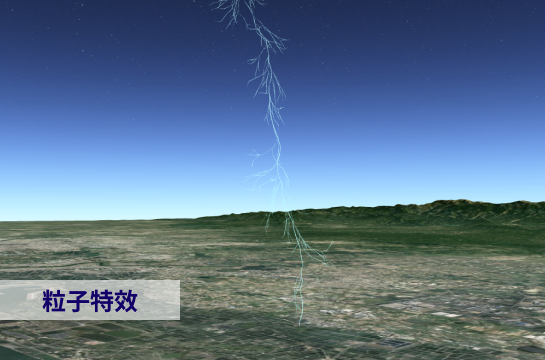
Particle Effect - Thunder
Particle Effects - Lightning Module: This combines the display with a timeline to show lightning particle effects in the virtual space at specific points in time.
Extending Widgets
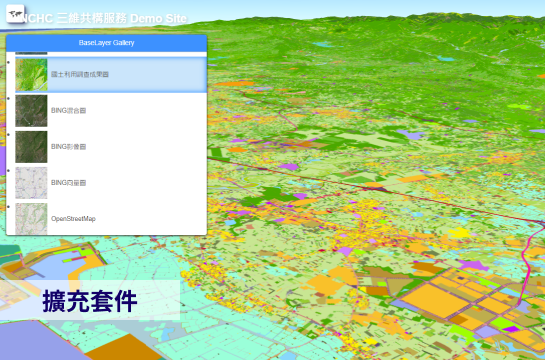
Base Layers
Provide preset base maps that allow users to quickly switch between them, including those interfaced through the National Land Surveying and Mapping Agency's GIS Cloud: Taiwan Electronic Map, Orthophoto Map, Land Use Survey Results Map, as well as Bing Map and OpenStreetMap.
Extending Widgets
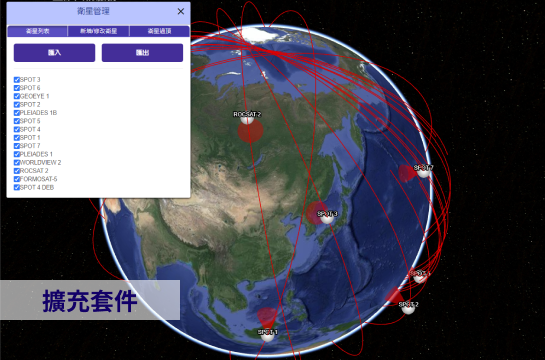
Satellites
Integrated with satellite information from N2YO, it can display the real-time positions and orbits of various satellites, as well as provide analysis features such as satellite overpass predictions.
Extending Widgets
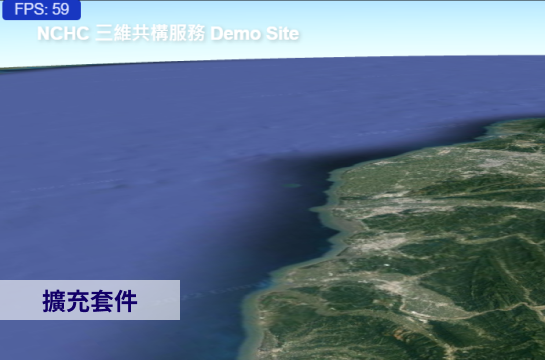
FPS Monitor
Provide an FPS monitoring tool that displays real-time frame rates (Frames Per Second; FPS) to monitor the smoothness of the visuals.
Extending Widgets
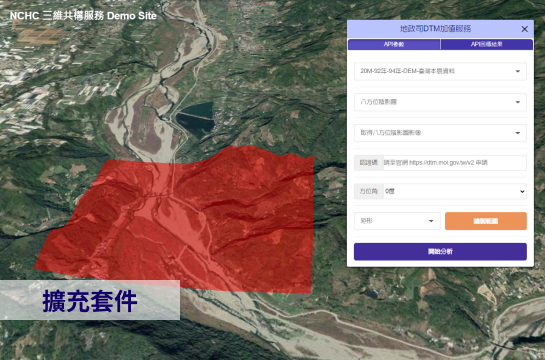
DTM Applications
Provide a simple development interface for the "Digital Elevation Model Value-Added Application Service," featuring 15 analysis modules and 34 demonstration functions, with the ability to overlay and display analysis results on the platform.
Extending Widgets
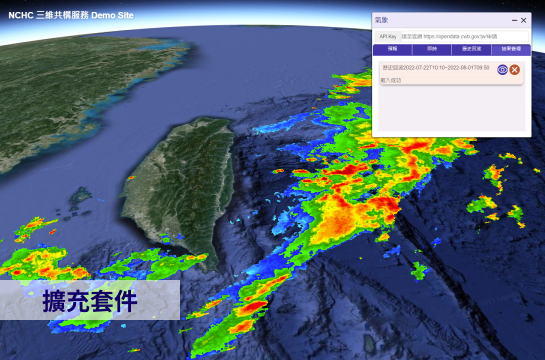
Weather
Provide a simple development interface to integrate with the "Central Weather Bureau" API, including features for querying and displaying weather forecasts, real-time weather information, and historical radar echoes.
Extending Widgets
Pipelines
Provide an underground pipeline extension module that can list and display underground models, such as pipelines, available on the server. It also supports integration with external resources and offers display functionality.
Extending Widgets
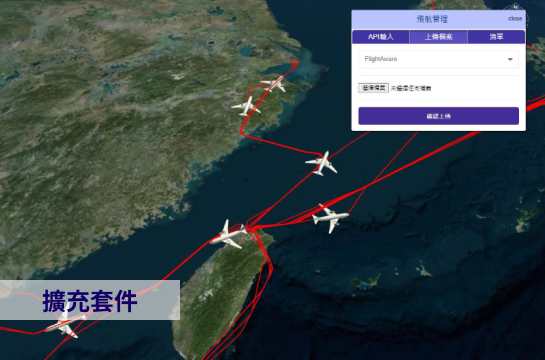
Flight Management
Provide a flight management extension module that can connect to the FlightAware flight tracking platform API (API Key obtained through self-registration) to retrieve and display global real-time flight information and their flight paths.
Extending Widgets
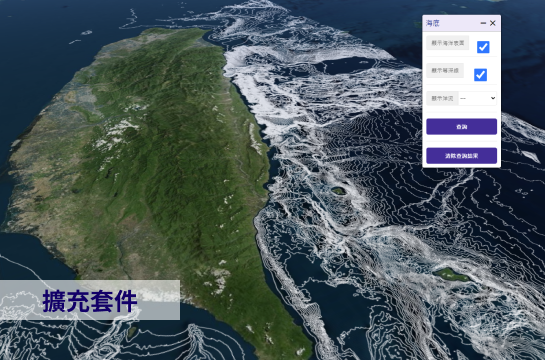
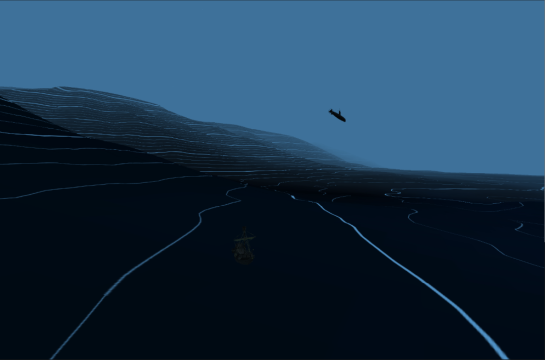
Seabed
An underwater topography extension module that can display server-provided information such as underwater terrain and contour lines. It can also show sea level and integrate ocean current data.
Extending Widgets
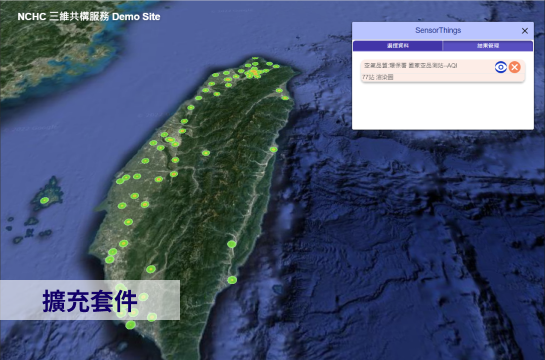
SensorThings
Provide a simple development interface to integrate with the "Public IoT" SensorThings API, and overlay the query results on the platform.
Extending Widgets
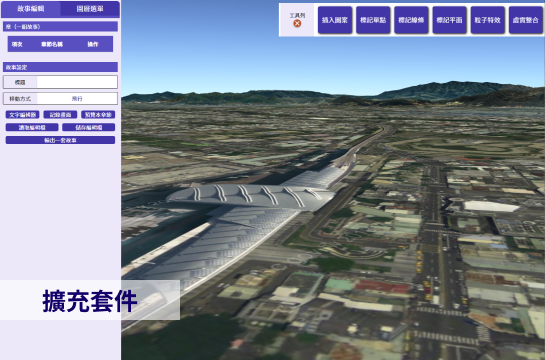
Story Map Editor
A user story editing extension module that allows users to attach relevant images to specific locations, edit landmark text, draw lines, planes, particle effects, and integrate virtual and real elements. Users can also switch base map layers and building models. By adding explanations to each location and playing them in sequence, a unique user story can be created.
Extending Widgets
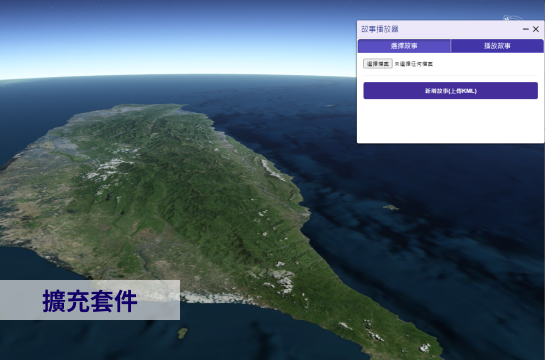
Story Map Player
A user story playback module that can load and review KML files edited and saved by the "User Story Editing Extension Module."
Extending Widgets
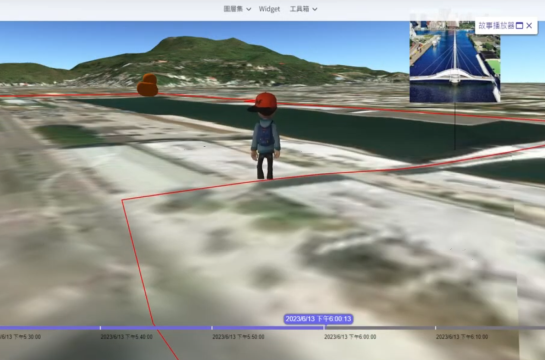
Story Map Video
The sample video uses a guided tour for Kaohsiung Harbor as an example. It introduces the complete process starting from the operation of the User Story Map editor, including path planning, chapter editing, adding images, and generating the output file. After importing the output file into the User Story Map player, the entire guided tour can be played.
Extending Widgets
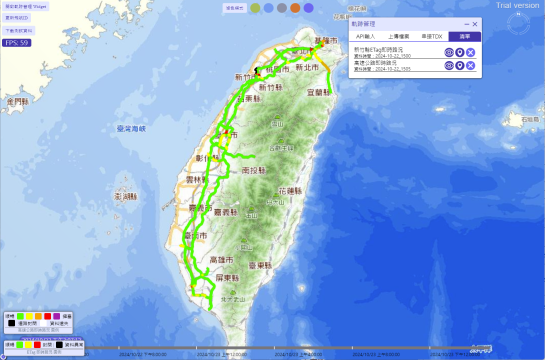
Track Management
The Track Management Module can connect to the FlightAware API to integrate real-time and historical flight information. It can also be drawn by path files such as GPX. It can also connect to the Ministry of Transportation's TDX API to display real-time traffic conditions and other relevant information.
Extending Widgets
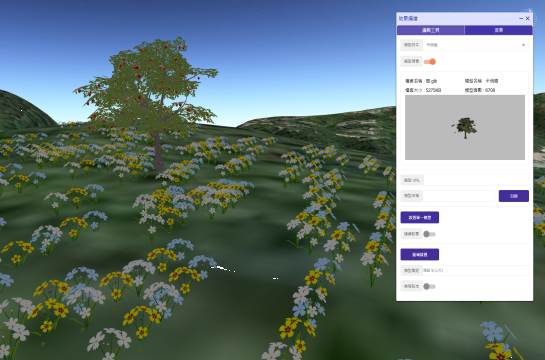
Scene Builder
The Scene Builder module allows users to quickly place objects in a 3D scene using 5 preset landscape models (such as flowers, trees, rocks, and buildings) or custom-uploaded models. It offers advanced options, including single-model placement and batch area placement, enabling users to efficiently design landscapes and enhance scene diversity and richness.

Extending Widgets
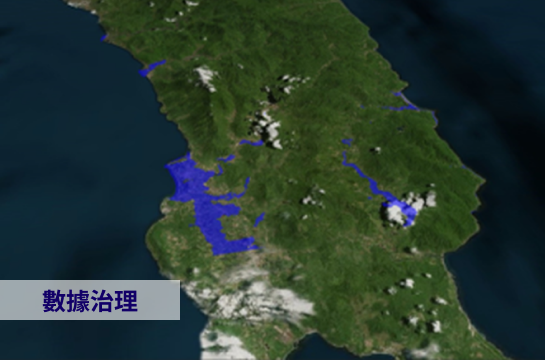
Geospatial Data Management System
The geospatial data management system assists developers in uploading, converting, and publishing geospatial data. It also includes access control features, allowing different groups to manage their respective datasets. Additionally, the system features a Map Wizard, which enables users to adjust styles and utilize geospatial data, helping developers quickly build front-end map platforms.
Cross Domain Data Management
Flood Vulnerability Assessment
Using multi-scenario rainfall and flood big data, this assessment analyzes the dynamic temporal evolution of flood extents to establish the relationship between flood grids and overflow points. It estimates the upstream rainfall-runoff concentration time for each related overtopping point and the overland flow travel time from overflow points to flood grids. Based on this, the accumulated rainfall over different durations is calculated to determine the critical flood-inducing rainfall for each grid. The computational process defines five flood threshold levels (0.1m, 0.3m, 0.5m, 1m, 2m) to aid decision-makers in monitoring and analysis, supporting smart urban governance.
Cross Domain Data Management
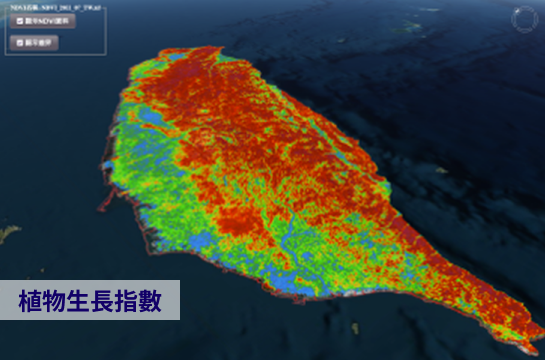
NDVI Demo
NDVI Vegetation Growth Index Display
Cross Domain Data Management
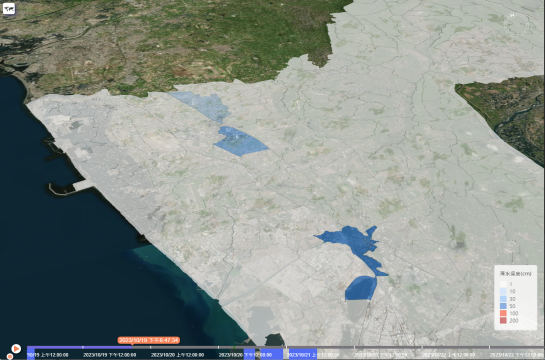
Flooding simulation(Datacube): Pingtung
Using Pingtung as a demonstration area, the flood numerical model can simulate hourly flood extents, providing high accuracy in monitoring water level changes within the observed range. The National Center for High-Performance Computing's 3D GIS platform can integrate real-time simulation analysis data from Datacube, offering precise flood extent and water height information. This aids relevant agencies in making informed decisions for disaster prevention and preparation.
Cross Domain Data Management
Flooding simulation(Datacube): Taichung
Using Taichung as a demonstration area, the flood numerical model can simulate hourly flood extents, providing high accuracy in monitoring water level changes within the observed range. The National Center for High-Performance Computing's 3D GIS platform can integrate real-time simulation analysis data from Datacube, offering precise flood extent and water height information. This aids relevant agencies in making informed decisions for disaster prevention and preparation.
AR / VR
3DTile Buildings VR Demo
The National Land Surveying and Mapping Center of the Ministry of the Interior provides building data for all counties and cities in Taiwan on the "Multi-Dimensional National Spatial Information Service Platform." This platform can integrate 3DTiles building data streams and display them in real-time virtual reality.
AR / VR
Photogrammertry Models VR Demo
Through images captured by drones and using oblique photography to transpose buildings, digital twin city models can be produced. This platform not only allows for the display of such city buildings on regular web pages but also offers virtual reality (VR) tour technology, enabling users to immerse themselves in virtual scenes.
AR / VR
Seabed VR Demo
"The underwater topography extension module provided by this platform can display underwater terrain on regular web pages and also offers virtual reality (VR) tour technology, allowing users to immerse themselves in the underwater world around Taiwan. VR Operation Instructions: When using a VR headset or simulator, enter the webpage, move your viewpoint to the desired location, and click the ""VR"" button to enter the VR environment. If the ""Show Ocean Surface"" option is selected, the view will transition to an underwater effect when the perspective is below sea level."
AR / VR
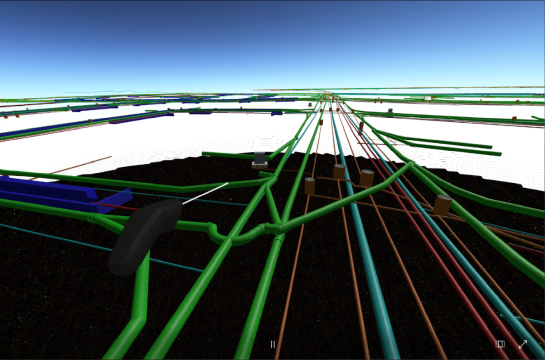
Pipelines VR Demo
The underground pipeline extension module provided by this platform can display underground pipelines on regular web pages and also offers virtual reality (VR) tour technology. This allows users to observe the relative positions of pipelines in VR space more directly. VR Operation Instructions: When using a VR headset or simulator, enter the webpage, open the Widget, and select the objects you wish to observe. The viewpoint will move to that location. At this point, lowering the transparency will display the pipeline data. After fine-tuning the viewpoint position, click the "VR" button to enter the VR environment and observe the pipelines.
AR / VR
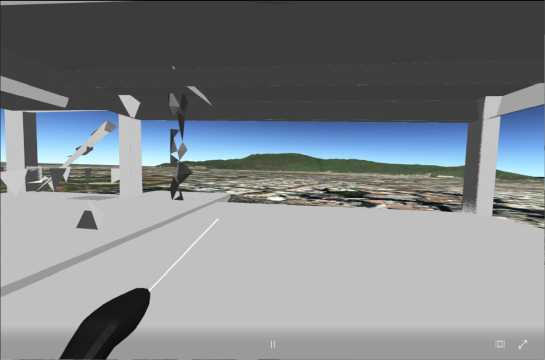
BIM Model VR Showcase
This platform provides a BIM building model module that allows BIM models to be displayed on standard web pages. Additionally, it supports virtual reality (VR) navigation, enabling users to walk through building interiors in a VR environment. This feature is ideal for applications such as VR indoor tours and immersive architectural exploration.
AR / VR
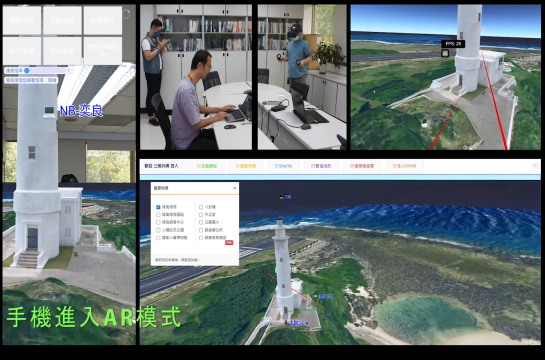
Multi-User Demo on Ludao
The video uses the Ludao Map Platform as an example to demonstrate the functionality of multi-user connections of 3DGDP. Users can connect to the same virtual space simultaneously by using different devices, such as web browsers on PC, AR on Mobile,, and VR headsets. It provid a platform for users to navigate and interact within a shared geospatial environment.